PROVIDENCE, R.I. [Brown University] — Out of an effort to account for what seemed in airborne images to be unusually large tree growth in a Hawaiian forest, scientists at Brown University and the Carnegie Institution for Science have developed a new mathematical model that predicts how trees compete for space in the canopy.
What their model revealed for this particular forest of hardy native Metrosideros polymorpha trees on the windward slope of Manua Kea, is that an incumbent tree limb greening up a given square meter would still dominate its position two years later a forbidding 97.9 percent of the time. The model described online in the journal Ecology Letters could help generate similar predictions for other forests, too.
Why track forest growth using remote sensing, pixel by pixel? Some ecologists could use that information to learn how much one species is displacing another over a wide area or how quickly gaps in the canopy are filled in. Others could see how well a forest is growing overall. Tracking the height of a forest’s canopy reveals how tall the trees are and therefore how much carbon they are keeping out of the atmosphere — that is, as long as scientists know how to interpret the measurements of forest growth.
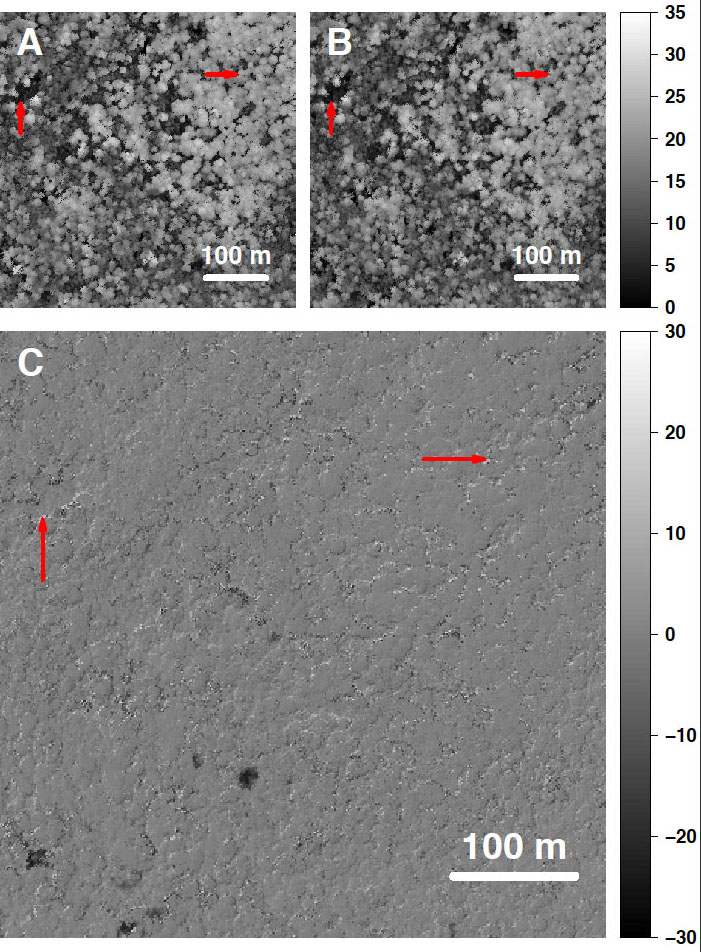
James Kellner, assistant professor of ecology and evolutionary biology at Brown University, the paper’s lead and corresponding author, noticed what seemed like implausibly large canopy growth in LIDAR images collected by the Carnegie Airborne Observatory over 43 hectares on the windward flank of Manua Kea. In the vast majority of pixels (each representing about a square meter) the forest growth looked normal, but in some places the height change between 2007 and 2009 seemed impossible: sometimes 10 or 15 meters.
The data were correct, he soon confirmed, but the jumps in height signaled something other than vertical growth. They signaled places where one tree had managed to overtop another or where the canopy was filling in a bare spot. The forest wasn’t storing that much more carbon; taller trees were growing a few meters to the side and creating exaggerated appearances of vertical growth in the overhead images.

Turning that realization into a predictive mathematical model is not a simple matter. Working with co-author Gregory P. Asner at the Carnegie Institution for Science in Stanford, Calif., Kellner created the model, which provides a probabilistic accounting of whether the height change in a pixel is likely to be the normal growth of the incumbent tree, a takeover by a neighboring tree, or another branch of the incumbent tree.
Tracking treetops
The model doesn’t just work for this forest but potentially for different kinds of forests, Kellner said, because its interpretation of the data is guided by the data itself. The model uses what seems to be the forest’s normal rate of growth to determine when evidence of vertical growth is more than plausible — and therefore a possible signal of lateral overtopping.
“While we can all agree that a 20-meter increase over two years is definitely not vertical growth, where you put the boundary, is a necessarily subjective decision,” Kellner said. “The neat thing about the analytical framework is you have the data choosing for you. The data arbitrate when a given height change is judged to be vertical rather than lateral, and that is based on the unique neighborhood around that position and what we’ve observed in the rest of the data.”
So even in an area where growth is quite uniform, the model can still predict whether a height change is due to growth or a takeover. Accounting for several neighborhoods, including some with more variance, can delineate trends such as how close trees have to be before one could overtop another.
Using the model, Kellner and Asner gained a number of insights beyond the huge incumbency advantage. They found that a tree’s height was a poor predictor of whether it would evade rivals. Very short trees (less than 11 meters) were clearly in some trouble, but beyond 11 meters tallness was not much of a factor. Instead, they saw, proximity to taller neighbors was a tree’s biggest threat.
“When a position in the canopy was lost to a neighbor, it was almost exclusively due to competition among the immediate neighbors (the 3-by-3 pixel neighborhood), which represented locations that were less than 1.77 meters away,” Kellner and Asner wrote. “Neighbors at greater distances accounted for just two of the 3,906 episodes of lateral capture inferred to have occurred in our data.”
But in a forest with trees capable of more dramatic lateral growth, that distance might end up being bigger. The model would illuminate that.
“There’s definitely basic ecological interest in understanding what might be called the rules of the game,” Kellner said. “If you think of the trees as competing for access to space in the canopy and we can infer what those rules are by analyzing data like these.”
The National Science Foundation (DEB-0715674) and the Carnegie Institution for Science funded the study.
